The police and crime commissioner (PCC) elections in England and Wales are set to take place next week (Thursday, 2 May 2024), as the public heads to the polls for what will be two and in some places three separate contests – PCCs, local councils, and mayoral elections.
Policing Insight will be keeping a close eye on the various contests, with a dedicated channel and a page for each police area being contested. In this article we take a look at the candidates and how the PCC political landscape might change following next month’s vote.
PCC Election 2024: Click a police area to view candidates and results from previous elections
Avon & Somerset | Bedfordshire | Cambridgeshire | Cheshire | Cleveland | Cumbria | Derbyshire | Devon & Cornwall | Dorset | Durham | Dyfed-Powys | Essex | Gloucestershire | Gwent | Greater London | Greater Manchester | Hampshire | Hertfordshire | Humberside | Kent | Lancashire | Leicestershire | Lincolnshire | Merseyside | Norfolk | North Wales | North Yorkshire | Northamptonshire | Northumbria | Nottinghamshire | South Wales | South Yorkshire | Staffordshire | Suffolk | Surrey | Sussex | Thames Valley | Warwickshire | West Mercia | West Midlands | West Yorkshire | Wiltshire
The candidates
This year there are 37 PCC posts being contested, two fewer than 2021, as the PCC role has been abolished in both North Yorkshire and South Yorkshire, where policing responsibilities are being handed over to the mayors and combined authorities.
These force areas will now join West Yorkshire (which moved to a mayor-led combined authority in 2021), Greater Manchester (2017), and the Mayor’s Office for Policing and Crime (MOPAC) in London, which has had responsibility for policing since PCCs were first introduced in 2012.
It was expected that the West Midlands would also become a combined authority after West Midlands Mayor Andy Street secured Home Office backing to abolish the PCC role for the 2024 elections, and take on policing powers.
However, this move has since fallen foul of a judicial ruling after current West Midlands PCC Simon Foster challenged the transfer of powers in the High Court. After the transfer was rejected on appeal last month, Mr Foster said: “The High Court has determined that the Home Secretary acted unlawfully and has quashed their decision of 6 February 2024, to approve the takeover of Police and Crime Commissioner powers by the West Midlands Mayor.
This article focuses on the PCC rather than mayoral elections; so, with 37 posts up for grabs, how many candidates is each party fielding?
What is noticeable is the decline in the number of independent candidates, which has dropped from 25 in 2021 to just 10 this year. This continues a trend that has been evident since the introduction of PCCs – the dominance of party candidates in a role originally envisaged as largely non-political.
- Conservative – 37
- Labour – 37
- Liberal Democrats – 35
- Green Party – 7
- Plaid Cymru – 4
- English Democrats – 3
- Reform UK – 2
- Independents and others – 10
For a full breakdown of candidates for each post, see the table at the end of this article.
What is noticeable in 2024 is the decline in the number of independent candidates, which has dropped from 25 in 2021 to just 10 this year. This continues a trend that has been evident since the introduction of PCCs – the dominance of party candidates in a role that was originally envisaged as largely non-political.
Both Reform UK and English Democrat parties have significantly reduced the number of candidates they are standing, down from a combined total of 13 in 2021 to five this year. The Green Party and Plaid Cymru are putting up the same number as the last election (seven and four respectively).
In total there are 31 incumbents standing for the 37 posts (26 Conservative, four Labour and one Plaid Cymru).
Once again, the candidate list is dominated by males; 75.6% of the candidates this year are male and 24.4% female (77.1% male, 22.9% female in 2021), while among the incumbents there are 23 males and eight females.
By comparison, in the House of Commons women account for over one third (34%) of MPs; in local government, women account for around the same proportion (35%) of councillors.
Looking also at the gender balance of candidates by political party, of the three parties fielding candidates in all PCC elections, Labour does ‘best’ with around one third of its candidates being female, while the Conservatives and Liberal Democrats have both selected women to represent them in under a quarter of their PCC campaigns.
Of the other parties, three of Plaid Cymru’s four candidates (75%), three of the Green Party’s seven candidates (42.8%), one of Reform UK’s 11 candidates (9.1%) and none of the English Democrats’ candidates are female.
Current landscape
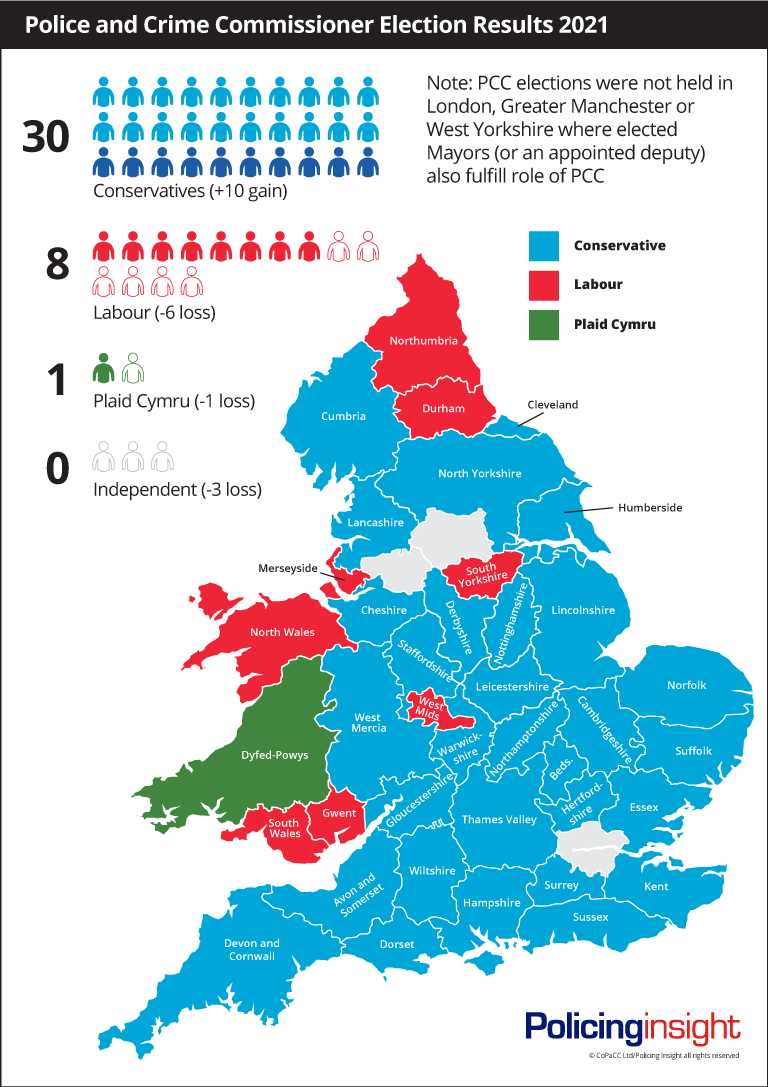
There was a ‘blue wave’ at the 2021 PCC election, with Conservatives winning 30 PCC regions (a gain of 10) and Labour losing six PCC regions, only managing to hold eight. Plaid Cymru lost one of its two PCC regions in Wales, and the last three independents lost, leaving all the PCC role to party politics.
PCC regions that might change hands
It is very difficult to predict the outcome of the 2024 PCC elections, with local issues and individual personalities often playing a significant part in any result. But if the PCC result does reflect the predicted swing in national politics currently expected in the general election later this year, it is conceivable that the Conservatives could lose the 10 regions they gained in 2021, replacing that year’s blue wave with a Labour red one in 2024.
Most susceptible to such a voting swing would be those PCC regions with narrowest margins in 2021, so here’s our ‘10 to watch’:
Avon and Somerset – Conservative held with a first round vote of 34.7% and most of the second round votes going to Labour. The region has a history of narrow margins in earlier elections.
Bedfordshire – Conservative held with first round of 41.8% vs Labour 34.5% which was reasonably comfortable but with Conservative and Labour much more closely matched in 2016 and 2012 will Labour put the incumbent under pressure in 2024? In October 2023 Labour won a by-election in the Mid Bedfordshire parliamentary seat which has been held by the Tories since 1931.
Cleveland – Conservative held and ostensibly looks safe with 52.6% against Labour 28.1%. However, with only two candidates being fielded there are opportunities for Labour to take the independent and Liberal Democrat votes, and the PCC region was comfortably won by Labour in 2012 and 2016.
Durham – Labour held with first round share of 43.8% versus the Conservative 43%. However, with a history of being Labour held with greater margins in 2016 and 2012 elections, it is likely to stay Labour.
Dyfed-Powys – Held by Plaid-Cymru, but with a very narrow first round margin of 32.5% vs Conservative 32.8%; could be vulnerable, although a heavy majority of the second-round votes went to Plaid Cymru, so likely to remain with the Welsh party.
Humberside – Conservative held with 45.6% vs Labour 39.4% in the first round; but the seat was won by Labour in 2016, so if the voting reflects the general election predictions, a Labour win is certainly possible.
Lancashire – Held by the Conservatives with a narrow first-round margin of 44.8% v Labour 41.6%, this PCC region was taken by Labour previously in both the 2016 and 2012 elections.
Leicestershire – Conservative held with a comfortable first round of 47.8% vs Labour 32.3%; however, with an extra two candidates (Green Party and Independent) potentially stealing votes this year, and the region being comfortably won by Labour in 2016, it is once again one to watch.
North Wales – Although Labour held this region, they were only second in the first-round vote with 29.1% vs Conservative 31.6% and Plaid-Cymru on 28.4%. Labour took it on second votes in the second round, but this could be a three-way race with a strong possibility of change.
Nottinghamshire – Conservative held with a first-round margin of 47.9% vs Labour 43.5%; a real possibility of change this year for a PCC region held by Labour in 2016 and 2012.
PCC Elections 2024: Confirmed candidate numbers by party and gender
Table legend
F – Female *F* – Female incumbent PCC for re-election
M Male *M* – Male incumbent PCC for re-election
G – Greens
PC – Plaid Cymru
ED – English Democrats
I – Independent & Other
R – Reform UK
| Force area | Political parties |
Number of candidates and by gender |
|||||||||
| C | L | LD | G | ED | R | PC | I | TOTAL | Female | Male | |
| Avon & Somerset |
*M* | F | M | F | 4 | 2 | 2 | ||||
| Bedfordshire | *M* | M | M | M | 4 | 0 | 4 | ||||
| Cambridgeshire | *M* | F | F | 3 | 2 | 1 | |||||
| Cheshire | *M* | M | M | 3 | 0 | 3 | |||||
| Cleveland | *M* | M | 2 | 0 | 2 | ||||||
| Cumbria | M | M | M | 3 | 0 | 3 | |||||
| Derbyshire | *F* | F | M | M | 4 | 2 | 2 | ||||
| Devon & Cornwall | *F* | M | M | 3 | 1 | 2 | |||||
| Dorset | *M* | M | M | F | 4 | 1 | 3 | ||||
| Durham | M | *F* | M | 3 | 1 | 2 | |||||
| Dyfed-Powys | M | F | M | *M* | 4 | 1 | 3 | ||||
| Essex | *M* | M | M | M | 4 | 0 | 4 | ||||
| Gloucestershire | *M* | M | M | M | 4 | 0 | 4 | ||||
| Gwent | F | F | M | F | 4 | 3 | 1 | ||||
| Hampshire | *F* | F | M | M | 4 | 2 | 2 | ||||
| Hertfordshire | M | M | M | M | 4 | 0 | 4 | ||||
| Humberside | *M* | M | M | 3 | 0 | 3 | |||||
| Kent | *M* | M | M | 3 | 0 | 3 | |||||
| Lancashire | *M* | M | M | 3 | 0 | 3 | |||||
| Leicestershire | *M* | M | M | F | F | 5 | 2 | 3 | |||
| Lincolnshire | *M* | M | F | M | M | 5 | 1 | 4 | |||
| Merseyside | M | *F* | M | F | 4 | 2 | 2 | ||||
| Norfolk | *M* | F | M | M | 4 | 1 | 3 | ||||
| North Wales | M | *M* | M | F | 4 | 1 | 3 | ||||
| North Yorkshire | |||||||||||
| Northamptonshire | M | F | F | 3 | 2 | 1 | |||||
| Northumbria | F | F | M | M | 4 | 2 | 2 | ||||
| Nottinghamshire | *F* | M | M | 3 | 1 | 2 | |||||
| South Wales | M | F | M | M | 4 | 1 | 3 | ||||
| South Yorkshire | |||||||||||
| Staffordshire | *M* | M | M | 3 | 0 | 3 | |||||
| Suffolk | *M* | M | M | F | 4 | 1 | 3 | ||||
| Surrey | *F* | F | M | M | 4 | 2 | 2 | ||||
| Sussex | *F* | M | M | M | 4 | 1 | 3 | ||||
| Thames Valley | *M* | M | M | M M | 5 | 0 | 5 | ||||
| Warwickshire | *M* | F | M | 3 | 1 | 2 | |||||
| West Mercia | *M* | M | F | M | M | 5 | 1 | 4 | |||
| West Midlands | M | *M* | 2 | 0 | 2 | ||||||
| Wiltshire | *M* | F | M | M | 4 | 1 | 3 | ||||
| TOTALS | 37 | 37 | 35 | 7 | 3 | 2 | 4 | 10 | 135 | 33 | 102 |
| Female | 8 | 14 | 4 | 3 | 0 | 0 | 2 | 2 | 33 | ||
| Male | 29 | 23 | 31 | 4 | 3 | 2 | 2 | 8 | 102 | ||