In this article, we’ll:
- illustrate HUME’s features using a synthetic dataset of crimes from San Francisco
- identify patterns and trends in the data that help describe the overall threat landscape of San Francisco
Exploring the San Francisco PD’s Incident Report Dataset
HUME can consolidate structured and unstructured data into a singular, coherent knowledge graph.
Curating quality data and maintaining its integrity is a Herculean task. In the modern digital age, data sources are vast and varied, each with distinct formats, structures, and reliability levels. With advanced features such as Orchestra, HUME can consolidate structured and unstructured data into a singular, coherent knowledge graph. This unified structure ensures that intelligence is rooted in a single source of truth, paving the way for actionable insights.
To understand the potential of strategic intelligence analysis, we must immerse ourselves in tangible, real-world data. The San Francisco Police Department (SFPD) offers a unique window into the world of incident reporting, with a comprehensive dataset of incidents since 2018.
Every entry in this dataset is a unique event in urban life. Each incident is catalogued with precision, detailing the date, time, and day of the week, providing a temporal landscape for analysis. Delving deeper, the dataset elucidates distinct categories, with reports filed by officers on the ground and those entered by the public via SFPD’s online portal.
Venturing into HUME’s graphical interpretation of the SFPD Reports
In the challenge to understand data, visualisation is crucial. Hume helps translate raw numbers and facts into comprehensible narratives. By harnessing Hume’s analytical features, the SFPD dataset transforms, evolving from a spreadsheet to a dynamic, interconnected graph. This transformation isn’t only cosmetic, it’s unveiling hidden narratives, relationships, and patterns that conventional data representations might overlook. Moreover, thanks to Neo4j, a graph-native database, under the hood analysis or visualisation is blazing fast.
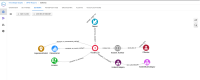
Figure 1 – SFPD (San Francisco police department) Knowledge Graph
Graph nodes
First, we will focus our attention on identifying patterns and trends within the data. From the entire schema, we will focus only on the following nodes to better describe the situation from a vantage point.
- Incident_ID: Each incident, uniquely identified, forms the backbone of our graph. This node becomes the starting point, the anchor from which every narrative unfolds. It captures the essence of every event, providing a singular identity that aids in tracking and analysis.
- Location: Mapping is crucial in crime analysis. The ‘Location’ node helps turn data points into spatial stories. By anchoring each incident to a specific locale, we can identify hotspots, discerning regional patterns, and understanding the dynamics of crime.
- IncidentCategory: At a higher level, the ‘IncidentCategory’ node categorizes and organizes the incidents. This node allows for aggregated analyses, understanding crime categories, and spotting overarching trends.
Graph edges
Correspondent with our primary focus nodes, the primary focus relationships, for this application, will reveal valuable insight into the data.
- INCIDENT_IN_POLICE_DISTRICT: This relationship links individual incidents to specific police districts. It paints a vivid picture of crime distribution, aiding in strategic resource allocation, understanding regional challenges, and ensuring law enforcement efforts are optimally directed.
- INCIDENT_IN_LOCATION: This relationship further solidifies the spatial aspect of the graph. By connecting the incident to its geographical stage, it offers a granular view—shedding light on crime distributions, understanding spatial patterns, and guiding tactical deployments.
By integrating nodes and edges, the graph transforms into a living entity. It offers more than isolated data points—it provides narratives, connections, and insights.
1. Incident heatmap
A heatmap of crimes in San Francisco visually represents crime concentrations across the city using a gradient colour scheme. Brighter shades indicate high crime rates in specific areas, while darker shades represent regions with fewer incidents. Divided into zones or grids, each corresponding to neighbourhoods or districts, this visual tool allows for rapid identification of ‘hotspots’ or high-risk areas. Overlay elements, like roads or landmarks, provide context, making the heatmap an invaluable asset for law enforcement to discern patterns, allocate resources effectively, and strategize preventive measures based on real-time data insights.
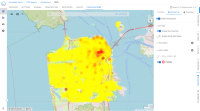
Figure 2 – Heatmap of San Francisco criminality
2. The passage of crime: Incidents over time
Visualising crime through the lens of time provides invaluable insights. On the x-axis, the passage of time unfolds, with each bar narrating the volume of incidents. Peaks signal turbulent periods, while troughs hint at moments of calm. Such temporal narratives are more than just patterns—they’re blueprints, guiding proactive measures and informing policy decisions.
In Figure 3 you will find a snapshot of the crimes that happened in the San Francisco area in April 2023. As we can easily identify, most of the crimes represented are property crimes, especially ‘Larceny’.
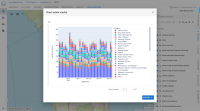
Figure 3 – A snapshot of incidents in April 2023
3. District dynamics: Incidents across police departments
Each district has its unique challenges and narratives. Visualising incidents across various police departments paints a vivid portrait of regional dynamics. A heatmap chart adds layers of understanding, segregating incidents by type and offering a comprehensive view of the multifaceted challenges each district faces.
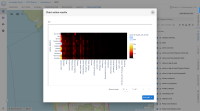
Figure 4 – Heatmap of incidents vs. police districts
4. Weekly rhythms: Incidents and days of the week
Crime doesn’t adhere to a schedule, and most of the time patterns emerge where we least expect. By mapping incidents across days of the week, we discern the unique cadence of crime. Some days might hum with activity, while others remain relatively serene. Such insights are pivotal, guiding tactical decisions, informing patrolling schedules, and revealing broader societal patterns.
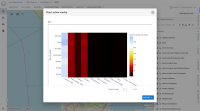
Figure 5 – Property incidents reflected over days of the week
5. Temporal tapestry: Interplay of days, hours, and incidents
Delving deeper into the temporal realm, this visualization offers a granular view of crime’s ebb and flow. Days stretch on one axis, hours on another, and the intensity of colours or the landscape narrates the frequency of incidents. Such granularity is a goldmine, pinpointing specific windows of time that may demand heightened vigilance.
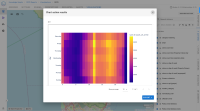
Figure 6 – Incident occurrence at Day of the week vs. time of day
6. A microscopic lens
Analyzing data through a microscope offers a level of detail akin to the broad overview provided by a bird’s-eye view.
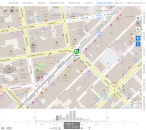
Figure 7 – Geographical view of the crime locations
Hume facilitates the expansion of incidents from a singular location, enabling users to categorise and extend these incidents within a graphical interface with ease. The Advanced Expand feature, integrated within the geographical view, allows for the precise filtering of pertinent events within a specified timeframe. This functionality underscores Hume’s capability to streamline intelligence analysis, making it an indispensable tool for professionals seeking efficient and effective data examination.
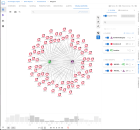
Figure 8 – Query results for expanding the Larceny Theft Incidents in a relevant timeframe specific to a location
This particular visualisation demonstrates the ability to categorise and contextualise incident data—specifically Larceny Theft Incidents—within a defined temporal and geographic scope. The nodes signify individual incidents and are interconnected to depict relationships and patterns. This network graph is a testament to Hume’s advanced data mapping capabilities, offering users a comprehensive graph view that is integral for identifying trends, connections, and outliers in complex data landscapes.
Conclusion
The landscape of law enforcement is not static; it’s an ever-evolving tapestry shaped by societal trends, technological advancements, and strategic foresight.
By harnessing HUME’s capabilities, law enforcement agencies can supercharge their operations, predict crime trends, allocate resources strategically, and craft policies that resonate with the times.
Graphaware HUME emerges as a beacon in this transformative journey. It’s more than just software; it’s a powerful ally, bridging the gap between raw data and actionable insights. By harnessing HUME’s capabilities, law enforcement agencies can supercharge their operations, predict crime trends, allocate resources strategically, and craft policies that resonate with the times.
As we stand on the edge of this new data era, one thing is clear: the fusion of high-quality data, advanced analytical tools like HUME, and strategic intelligence analysis will shape the future of law enforcement.
Discover the power of Knowledge Graphs in Criminal Intelligence Analysis – download our ebook “Three steps to intelligence-led policing: How knowledge graphs make a safer world”.